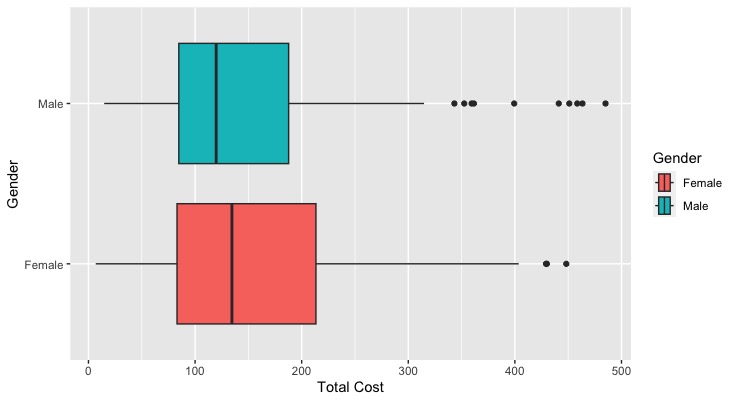
Spending habits by Gender
Here is a problem where I extracted information from a csv file. Then, I used dyplr and ggplot to filter through the data and create a plot that divides two groups by gender and their spending habits.
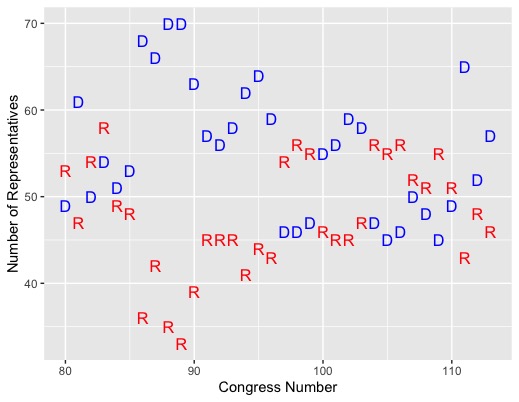
Groupby data visual
In this problem I extracted data on congress. I first used the group by method to distingiush members by congress number and party. Then, I used dplyr, pipes, and ggplot to make the diagram.
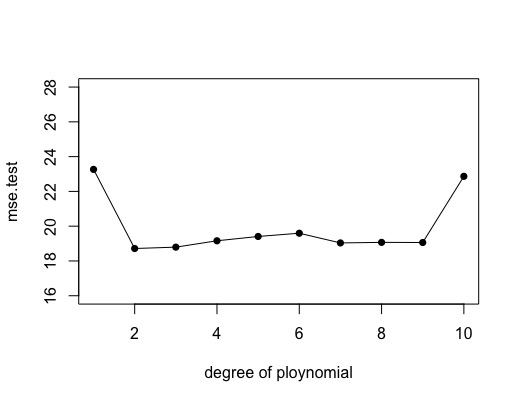
Regressions vs Predictive Power
I used a for loop and multiple regression to test how increasing the degree of the polynomial would affect the mean squared error. In other words, is the increase in computing power required justified by the increase in predictive power.